Batching, compression and throughput
The last two lessons made writes correct. This one makes them efficient. You'll see how the producer groups records, why one setting can multiply the work your brokers do, and how to measure the effect instead of guessing.
Theory
Example: the load test
Brightlane is about to take over the chargers of a motorway service-station operator: 6,000 more chargers, about 25 times today's traffic. Before signing, the platform team load-tested the charger gateway at the expected peak of 2,500 meter readings a second. Two results worried them:
- The gateway sent about 2,400 produce requests a second, almost one per reading. A year
earlier someone had set
linger.ms=0"for the lowest possible latency". At today's 16 readings a second nobody noticed; at 2,500 it kept the brokers' request threads busy. - The projected storage for three days of telemetry was 260 GB: 335 KB a second, three replicas, three days. Yet the readings are short JSON documents that repeat the same field names again and again.
Both come down to the producer's batching and compression settings.
Batches, not records
A producer never sends one record at a time on purpose. produce() puts the record into the
client's local queue, in a batch for its partition. A background thread sends batches to the
brokers. One produce request carries the waiting batches for all of the partitions that one
broker leads.
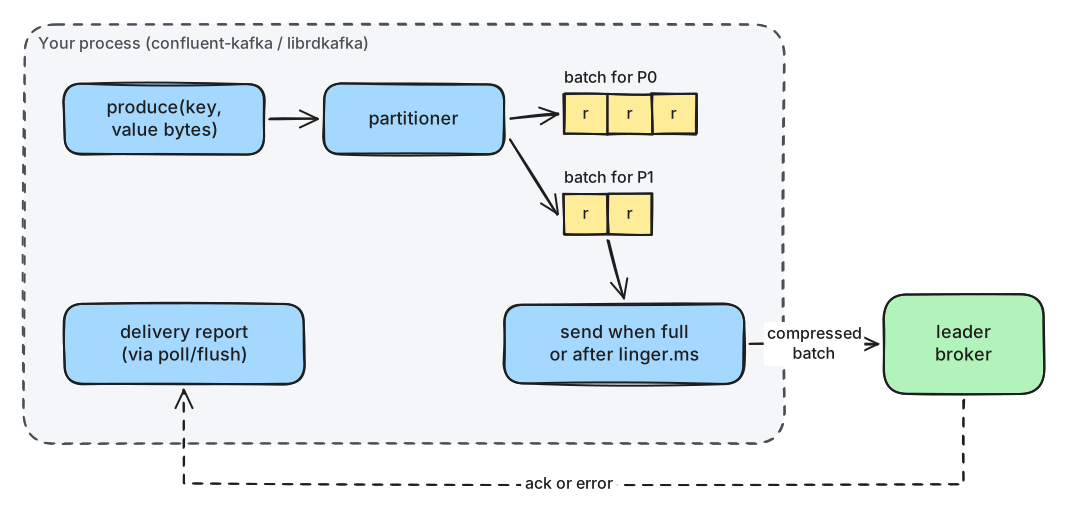
What to notice: your code and the network are decoupled by the queue. produce() returns at
once; the sending happens later, in batches.
Each request has a fixed cost: a network round trip, and work on the broker to receive, check, write and answer it. Each byte has a cost too: network, disk, and replication to the followers. Batching cuts the number of requests; compression cuts the bytes.
linger.ms and batch.size
A batch is sent when the first of these happens:
- it is full: it has reached
batch.sizebytes. The Python client's default is 1,000,000 bytes (it also caps a batch at 10,000 records withbatch.num.messages); the Java default is 16 KB. - it has waited
linger.msmilliseconds since its first record. The default is 5 ms in the Python client, and in Java since Kafka 4.0 (it was 0 before).
Which limit matters depends on how the records arrive:
- In a steady stream, like the gateway's live readings, batches rarely fill up.
linger.msdecides how many records a request carries, and it adds up to that much delay to each record. - In a burst, like replaying a backlog, batches fill long before
linger.msruns out.batch.sizethen sets the request size, and records wait in the local queue behind each other.
The queue itself is limited: 100,000 records or 1 GB by default in the Python client
(queue.buffering.max.messages, queue.buffering.max.kbytes). When it's full, produce() raises
BufferError. Then call poll() to let deliveries drain, and try again.
Compression
compression.type compresses each batch as a whole: none (the default), gzip, snappy, lz4
or zstd. The broker stores and replicates the batch compressed, and the consumer decompresses
it. So compression saves network bytes from the producer, between brokers and to every consumer,
plus disk on every replica.
Fuller batches compress better, because there's more repetition to find. JSON with repeated field
names compresses very well. zstd usually gives the best ratio and lz4 the lowest CPU cost. Both
beat gzip on speed. The price is CPU time in the producer and in every consumer.
Measure, don't guess
Throughput and latency trade against each other, and the numbers depend on your data, your network and your brokers. Measure with realistic records, and look at:
- throughput: records or bytes per second;
- latency percentiles: the median (p50) and a tail value (p99), not the average;
- records per request: from the client's statistics, the clearest view of batching.
In production
- For steady streams, set
linger.msto what your latency budget allows: 5 to 50 ms. For bulk loads, raise it further; batches will fill anyway. - Turn on
zstdorlz4for text formats like JSON. Keep the topic's owncompression.typeatproducer(the default), so brokers store batches as received instead of recompressing them. - In Python, keep the default
batch.size(1 MB). In Java, raise it from 16 KB to 64–256 KB for high-volume producers. - Handle
BufferError, and watch request rates and batch sizes per client (lesson 8.3). In the cloud, traffic between availability zones costs money per gigabyte, so fewer bytes is also cheaper.
Practical
Note
Notebook: code/module-02/03-batching-compression-and-throughput.ipynb
· Lab services: kafka-1, kafka-2, kafka-3 · Time: ~13 min
What you'll do: time the gateway's two kinds of writing: a steady stream with three
linger.ms values, then a 100,000-record replay with and without compression. Then shrink
batch.size and watch throughput collapse. Your numbers will differ from the ones shown here,
which come from one run on an Apple Silicon Mac. Compare the rows, not the absolute values.
Step 1: Prepare the readings
100,000 readings, 13.4 MB, average 134 bytes
Step 2: A function that times one write
send(label, records, rate=None, **config) recreates the topic, writes one warm-up record to
open the connections, then writes the records, as fast as possible or at a steady rate. Each
delivery report records the record's latency, the time from produce() to the acknowledgement:
                p.produce(TOPIC, key=key, value=value,
                          on_delivery=lambda err, msg: latencies.append(msg.latency()))
When the local queue is full, produce() raises BufferError, and the function polls and tries
again:
            except BufferError:
                p.poll(0.05)
At the end it reads the number of produce requests from the client's statistics.
Step 3: A steady stream with linger.ms 0, 5 and 50
steady = [send(f"linger {ms}", backlog[:5000], rate=2500, **{"linger.ms": ms}) for ms in (0, 5, 50)]
settings   readings/s  p50 ms  p99 ms  records/request
---------  ----------  ------  ------  ---------------
linger 0   2500        0.8     4.5     1.0
linger 5   2498        4.8     10.0    3.3
linger 50  2498        28.0    56.4    22.0
Step 4: The backlog, as fast as possible, with and without compression
plain = send("burst, none", backlog)
plain_bytes = stored_bytes()
zstd = send("burst, zstd", backlog, **{"compression.type": "zstd"})
stored_bytes() adds up the topic's size on all brokers, from kafka-log-dirs.sh:
settings     readings/s  p50 ms  p99 ms  records/request
-----------  ----------  ------  ------  ---------------
burst, none  685509      39.0    84.2    1639.3
burst, zstd  859817      5.5     43.3    1087.0

stored on disk (3 replicas): none 46.0 MB, zstd 4.7 MB (9.7x smaller)
Change it: a tiny batch.size
Predict first: replay the burst again, but cap each batch at 1,000 bytes, about seven readings. What happens to records per request and to throughput?
tiny = send("burst, batch.size 1000", backlog, **{"batch.size": 1000})
settings                readings/s  p50 ms  p99 ms  records/request
----------------------  ----------  ------  ------  ---------------
burst, none             685509      39.0    84.2    1639.3
burst, batch.size 1000  33952       1401.9  2777.7  5.0
What just happened
In the steady stream, throughput was the same in every row, because it was set by the rate we
sent at. What changed was the work per record. With linger.ms=0 each reading went in a request
of its own: the load test's problem. With 50 ms, each request carried 22 readings
(the batches for several partitions), at the price of about 27 ms more median latency. In the
burst, batches filled up long before linger.ms mattered: over a thousand records per request.
Latency there came from records queuing behind each other in the client. Compression shrank the
stored topic almost tenfold. Throughput even went up, because fewer bytes had to cross the network
and reach the disks. With a 1,000-byte batch.size, each request carried five records, and the
per-request cost cut throughput twentyfold.
Clean up
The last cell deletes the topic. If anything gets stuck, docker compose down -v in the code/
folder resets the whole lab.
Key takeaways
- Producers send batches; each request has a fixed cost, so records per request is the number to watch.
- A batch goes when it's full (
batch.size) or has waitedlinger.ms; steady streams depend onlinger.ms, bursts onbatch.size. linger.ms=0multiplies requests for a millisecond or two of latency; 5–50 ms is usually the better trade.- Compression works per batch and pays off on network, replication and disk;
zstdorlz4suit JSON. - Measure throughput, p50/p99 latency and records per request with your own data.
Next: Module 2 exercises