Observability: metrics, lag and alerts
A cluster and its services fail in a few typical ways, and each one shows up in a few numbers first. This lesson collects those numbers in Prometheus, from the brokers and from a Python service, and turns them into alerts.
Theory
Example: the 02:00 page
At 02:10 on a Saturday the on-call engineer's phone rang: BillingLagHigh: billing is 2,056 session events behind. Two teams could be at fault: the platform team that runs Kafka, and the billing team. Waking the wrong one costs an hour, and drivers' charges are late meanwhile. Within a few minutes the engineer needs three answers:
- Is the cluster healthy?
- Is billing running?
- Are more sessions arriving than usual?
Each answer is a number that someone has to collect before the night it's needed.
From the broker to Prometheus
Kafka brokers are Java programs, and report their internal numbers through JMX (Java Management
Extensions), Java's built-in way to expose measurements. Each number is an attribute of a named
object, such as kafka.server:type=ReplicaManager,name=UnderReplicatedPartitions.
Prometheus is a widely used open-source monitoring system. It scrapes its targets: every few
seconds it fetches a text page of metrics from each one over HTTP, and stores each value with its
time. A value's history is a time series. Metrics carry labels, such as job="kafka" or
topic="charging.sessions", and a query picks series by them: up{job="kafka"}.
To scrape a broker, the lab runs the JMX exporter as a Java agent inside each broker. It serves
the JMX values on port 7071 under Prometheus names, such as
kafka_server_replicamanager_underreplicatedpartitions. A rules file, lab/kafka/kafka-jmx.yml,
picks which values to export and how to name them.
Consumer lag needs the committed offsets of every group, which no single broker reports as a metric. KMinion, a small open-source exporter, asks the cluster for them and serves lag per group and topic. Burrow and kafka-lag-exporter are alternatives.
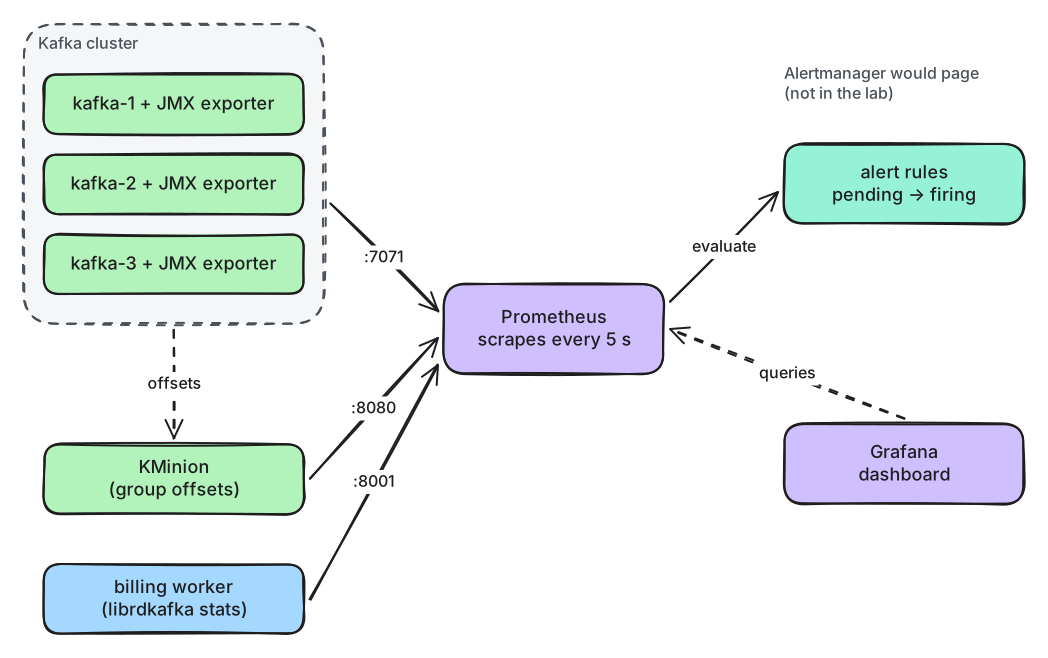
What to notice: Prometheus pulls from every target. A target that stops answering is itself a
signal: its up metric becomes 0.
The cluster's health in six numbers
| Signal | Prometheus query in the lab | Healthy |
|---|---|---|
| Brokers answering | sum(up{job="kafka"}) |
all of them |
| Active controllers | sum(kafka_controller_kafkacontroller_activecontrollercount) |
exactly 1 |
| Under-replicated partitions | sum(kafka_server_replicamanager_underreplicatedpartitions) |
0 |
| Under min ISR | sum(kafka_server_replicamanager_underminisrpartitioncount) |
0 |
| Offline partitions | max(kafka_controller_kafkacontroller_offlinepartitionscount) |
0 |
| Request handlers idle | min(kafka_server_kafkarequesthandlerpool_requesthandleravgidlepercent) |
above 0.3 |
They answer different questions. Under-replicated partitions (lesson 4.1) mean a copy is missing:
the data is at risk, but clients still work. Under min ISR means writes with acks=all fail on those
partitions. Offline partitions have no leader at all: nobody can read or write them. The request
handlers' idle share says how busy a broker is; below about 30%, requests start to queue.
Add throughput (kafka_server_brokertopicmetrics_bytesin_total, as a rate), request latency (the
99th percentile of kafka_network_requestmetrics_totaltimems per request type) and free disk space,
and you can answer "is the cluster healthy?" in one glance.
Consumer lag: records and seconds
Consumer lag in records is the end offset minus the group's committed offset (lesson 3.1). Two places can measure it:
- The cluster's view, from committed offsets, as KMinion reports it. It works even when the consumer is dead, which is when you need it most. But it only moves when the group commits: with auto-commit every 5 seconds at 40 events a second, a healthy billing group shows anything from 0 to about 200.
- The client's view, from the last record it processed. It's fresher, but it disappears with the client.
Records are a poor unit for an alert. 500 records behind is 12 seconds of sessions at 40 a second, half a second at the growth plan's peak, and minutes at night. What matters to drivers is time: lag in seconds, how old the oldest unprocessed event is. Exercise 2 builds an alert on it.
Metrics from Python clients
The Python client has no JMX. Instead, librdkafka collects detailed statistics and, with
statistics.interval.ms set, hands them to a stats_cb callback as a JSON document: per broker,
connection state, round trips and throttle times; per partition, offsets and lag; and totals such as
bytes sent and messages waiting. The billing worker of this lesson picks out the lag, and serves it
next to its own business metrics with the prometheus_client package:
def on_stats(raw):
    """Turn librdkafka's statistics JSON into Prometheus metrics."""
    stats = json.loads(raw)
    for topic in stats.get("topics", {}).values():
        for partition, p in topic["partitions"].items():
            if partition != "-1" and p.get("consumer_lag_stored", -1) >= 0:   # from the last processed record
                LAG.labels(partition).set(p["consumer_lag_stored"])
Business metrics, such as sessions charged and the age of the last event processed, often say more than client internals. A sudden drop in charges per minute is visible before any lag alert fires.
Since Kafka 3.7 (KIP-714), clients can also push their metrics to the brokers, and a broker plug-in passes them on to your monitoring system. That helps when you don't control the clients' code; it needs such a plug-in on the brokers.
Alert rules
An alert rule is a query plus a duration. Prometheus evaluates it every few seconds:
      - alert: KafkaUnderReplicatedPartitions
        expr: sum(kafka_server_replicamanager_underreplicatedpartitions) > 0
        for: 30s
While the query returns something, the alert is pending. Once that has lasted for the for
duration, it is firing, and Prometheus hands it to Alertmanager, which pages the on-call person.
The lab has no Alertmanager; the notebook reads the alerts from Prometheus's API.
Page on what users feel, and on a few causes that always need a person:
- billing (or any important consumer) behind by more than its time budget;
- offline partitions, or partitions under min ISR;
- not exactly one active controller;
- a broker down, or a disk nearly full.
Under-replicated partitions alone are a ticket, not a page, unless they last: every rolling restart (lesson 8.4) causes some.
In production
- Use
fordurations of minutes, not the lab's seconds, so restarts and short blips don't page. - Keep the number of time series in check. Per-partition metrics on thousands of partitions add up; export what you query, as the lab's JMX rules do (183 metric names instead of about 1,850).
- Every alert gets a runbook: what to check first, and what each answer means. Put its link in the alert, so the person paged at 02:00 doesn't start from nothing.
- Watch the monitoring itself: an alert on
up == 0for every target, and one that fires when Prometheus can't evaluate its rules. - Managed services export most broker metrics for you (for example to CloudWatch for Amazon MSK, or through Confluent Cloud's metrics API). Consumer lag and client metrics stay your job.
Practical
Note
Script: code/module-08/metered_worker.py (the notebook starts and stops it)
· Notebook: code/module-08/03-metrics-lag-and-alerts.ipynb
· Lab services: kafka-1..3, prometheus, kminion, grafana (docker compose --profile monitoring up -d --wait; the notebook starts them) · Time: ~18 min
What you'll do: read Prometheus's targets and the cluster's health, run billing with its own metrics, open the dashboard, stop a broker and watch the alerts, then stop billing and answer the 02:00 question.
Step 1: What Prometheus collects
job       instance                   health  last error
--------  -------------------------  ------  ---------------------------------------------
services  host.docker.internal:8001  down    Get "http://host.docker.internal:8001/metrics
kafka     kafka-1:7071               up
kafka     kafka-2:7071               up
kafka     kafka-3:7071               up
kminion   kminion:8080               up
The services target is your Mac, seen from Docker. Nothing serves port 8001 yet.
Step 2: The cluster's health in six numbers
show_health() runs the six queries of the table above:
signal                       now
---------------------------  ----
brokers answering            3
active controllers           1
under-replicated partitions  0
under min ISR                0
offline partitions           0
request handlers idle (min)  0.99
Step 3: Billing runs and publishes its own metrics
The session feed writes 40 events a second to m08l03-sessions; metered_worker.py bills them as
group m08l03-billing and serves its metrics on port 8001. After 30 seconds:
billing_sessions_charged_total 551.0
billing_consumer_lag{partition="0"} 1.0
billing_consumer_lag{partition="1"} 0.0
billing_consumer_lag{partition="2"} 0.0
billing_last_event_age_seconds 0.019820213317871094
billing_rebalances_total 1.0
Then both views of the lag, four times, 5 seconds apart:
KMINION_LAG = f'sum(kminion_kafka_consumer_group_topic_lag{{group_id="{GROUP}"}})'
WORKER_LAG = "sum(billing_consumer_lag)"
lag, KMinion (committed):   50   worker (processed):    1   arriving: 40/s
lag, KMinion (committed):   50   worker (processed):    1   arriving: 40/s
lag, KMinion (committed):   48   worker (processed):    0   arriving: 40/s
lag, KMinion (committed):   49   worker (processed):    0   arriving: 40/s
Step 4: The dashboard
Grafana starts with the Prometheus data source and the Brightlane dashboard already provisioned.
The notebook prints its address and each panel's query. Open
http://127.0.0.1:3000/d/brightlane-kafka/brightlane-kafka in your browser; it needs no login.
Keep it open for the next two steps.
Step 5: A broker stops
The notebook stops kafka-2 and prints the numbers and the cluster alerts every 5 seconds:
$ docker compose stop kafka-2
+  5 s  brokers up: 2  under-replicated: 203
+ 10 s  brokers up: 2  under-replicated: 203  KafkaBrokerDown pending, KafkaUnderReplicatedPartitions pending
...
+ 25 s  brokers up: 2  under-replicated: 203  KafkaBrokerDown firing, KafkaUnderReplicatedPartitions pending
...
+ 40 s  brokers up: 2  under-replicated: 203  KafkaBrokerDown firing, KafkaUnderReplicatedPartitions firing
The number of under-replicated partitions depends on the topics in your lab. Then the notebook starts kafka-2 again:
$ docker compose up -d --wait kafka-2
cluster alerts cleared 10 s after kafka-2 was back
Break it: the 02:00 page
Predict first: billing's process stops while sessions keep arriving. Which numbers change, and which alert fires when?
+  5 s  lag (KMinion):    56  worker answering: 0  BillingLagHigh inactive
+ 10 s  lag (KMinion):   257  worker answering: 0  BillingLagHigh inactive
+ 15 s  lag (KMinion):   456  worker answering: 0  BillingLagHigh inactive
+ 20 s  lag (KMinion):   656  worker answering: 0  BillingLagHigh inactive
+ 25 s  lag (KMinion):   856  worker answering: 0  BillingLagHigh pending
...
+ 55 s  lag (KMinion):  2056  worker answering: 0  BillingLagHigh firing
The cluster's health, and what still arrives:
under-replicated partitions  0
under min ISR                0
offline partitions           0
request handlers idle (min)  0.98
sessions arriving: 40/s   billing worker answering: 0
firing: ['BillingLagHigh']
What just happened
Prometheus collected three kinds of metrics through one mechanism: it scraped each target's page
every 5 seconds. A target that didn't answer, first the worker and then kafka-2, showed up as
up = 0.
The two lag views differed as the theory said. The worker knew it was at most one record behind. KMinion saw about 50 in this run, and sees anything up to about 200 in others, because it only sees committed offsets, and the worker commits every 5 seconds. Both are right; they measure different things.
When kafka-2 stopped, 203 partitions lost a replica from their ISR at once. Each alert waited for its
for duration: KafkaBrokerDown (15 s) fired after about 25 seconds and the under-replicated alert
(30 s) after about 40, counting scrape and evaluation intervals. Both cleared 10 seconds after
kafka-2 was back and caught up.
In the break-it step, the lag grew by 200 records every 5 seconds, the feed's 40 a second. It passed 500 after about 15 seconds; the alert was pending from 25 seconds and firing at 55. Then the three 02:00 questions had clear answers. The cluster was healthy: all brokers up, no partition at risk, idle request handlers. Billing wasn't running: its target didn't answer. Sessions arrived at their usual 40 a second. So: call the billing team, not the platform team.
Clean up
The last cell stops the feed and deletes the topic and the group. The monitoring services keep
running for exercise 2; to stop them: docker compose --profile monitoring stop.
Key takeaways
- Prometheus scrapes metrics pages: brokers through the JMX exporter, consumer lag through KMinion, Python services through their own
/metrics. - Six numbers answer "is the cluster healthy?": brokers up, one active controller, and zero under-replicated, under-min-ISR and offline partitions, plus request handler idle time.
- The cluster's lag view comes from committed offsets and survives a dead consumer; the client's view is fresher but dies with it.
- Alert on lag in time rather than records; the right record threshold changes with the traffic.
- An alert is pending until its condition has held for
for, then firing; page on what users feel, and give every alert a runbook.